
Back in May we decided to re-platform our production database to Neo4J. The architectural considerations and choices are quite interesting (if you like that sort of thing!) so I'm sharing in the hope it will prove useful to others.
Why graphs?
At Hoppa, the bulk of our work is about defining complex relationships between data entities, such as documents, table entries (risk registers, product catalogues) or taxonomies (Uniclass, NRM).
Our previous database was a JSON key-value store. The main advantage for us was speed-to-value – adopting consistent JSON object structures across frontend, API, storage and analytics layers reduced the amount of data transformation logic we needed to write and made it quicker to build and deploy custom workflows for customers.
This approach has its limits however, particularly when document volumes scale into the tens of thousands or aggregating across customer projects. To put it another way, our stack was perfect for flagging to a customer that a document contained asbestos-related information – but summarising all asbestos-related documents across their estate? Not so easy. Moving up the strategic value chain from data cataloguing to knowledge mining was the next frontier for us as a business.
Graph databases are great at traversing networks and finding patterns across data points, offering superior performance for relationship-heavy queries compared to traditional relational databases. They can also be easily adapted to evolving relationship structures without requiring complex schema changes. This is potentially transformational in built environment contexts where data is often de-normalised and distributed across many systems, and data schemas need to evolve over the asset lifecycle.
We’re seeing more teams turn to graphs for LLM context engineering - traversing a graph to identify related concepts, retrieve contextually relevant information, and construct better prompts for the LLM. We want to help customers build knowledge graphs in more mechanised, reliable ways – recognising this as a repeating challenge across the built asset lifecycle where data is often unstandardised and unstructured, thus making manual knowledge graph construction an expensive process.
What were the challenges?
Firstly, how to deal with changing business logic. As mentioned above, schema flexibility is (generally speaking) an advantage of graph databases. When cataloguing customer data, we’re all about flexibility - our bring-your-own-schema model means we could already configure the metadata specification to exact customer requirements.
However, we soon noticed that if business definitions aren’t consistent or change over time then our inter-linked graph could start returning some spurious query results. Take the example of HVAC equipment test certificates. Certificate validity period could be defined by Project Team A as a duration (in months) and by Project Team B as a date range. Spotting this inconsistency would be challenging as Neo4J (by design) doesn’t support complex property assertion logic out-of-the-box.
The second challenge was dealing with protected terms between customers. An example of a protected term is ‘Project’ or ‘Discipline’, which has a specific definition in the context of the customer’s business. These examples are common terms used widely across the built asset lifecycle in subtly different ways.
In Neo4J, terms are protected at the database, not the sub-graph level. If a graph node type of ‘Project’ is defined, and a constraint applied to specify that all Customer A ‘Projects’ must have a ‘Reference Number’ property then this constraint would also be enforced on Customer B Project nodes (even though their sub-graphs are segregated from each other). Customer B may not want a Reference Number property for their Project classifications. Spinning up new database instances every time a conflict like this was identified wasn’t a scalable option.
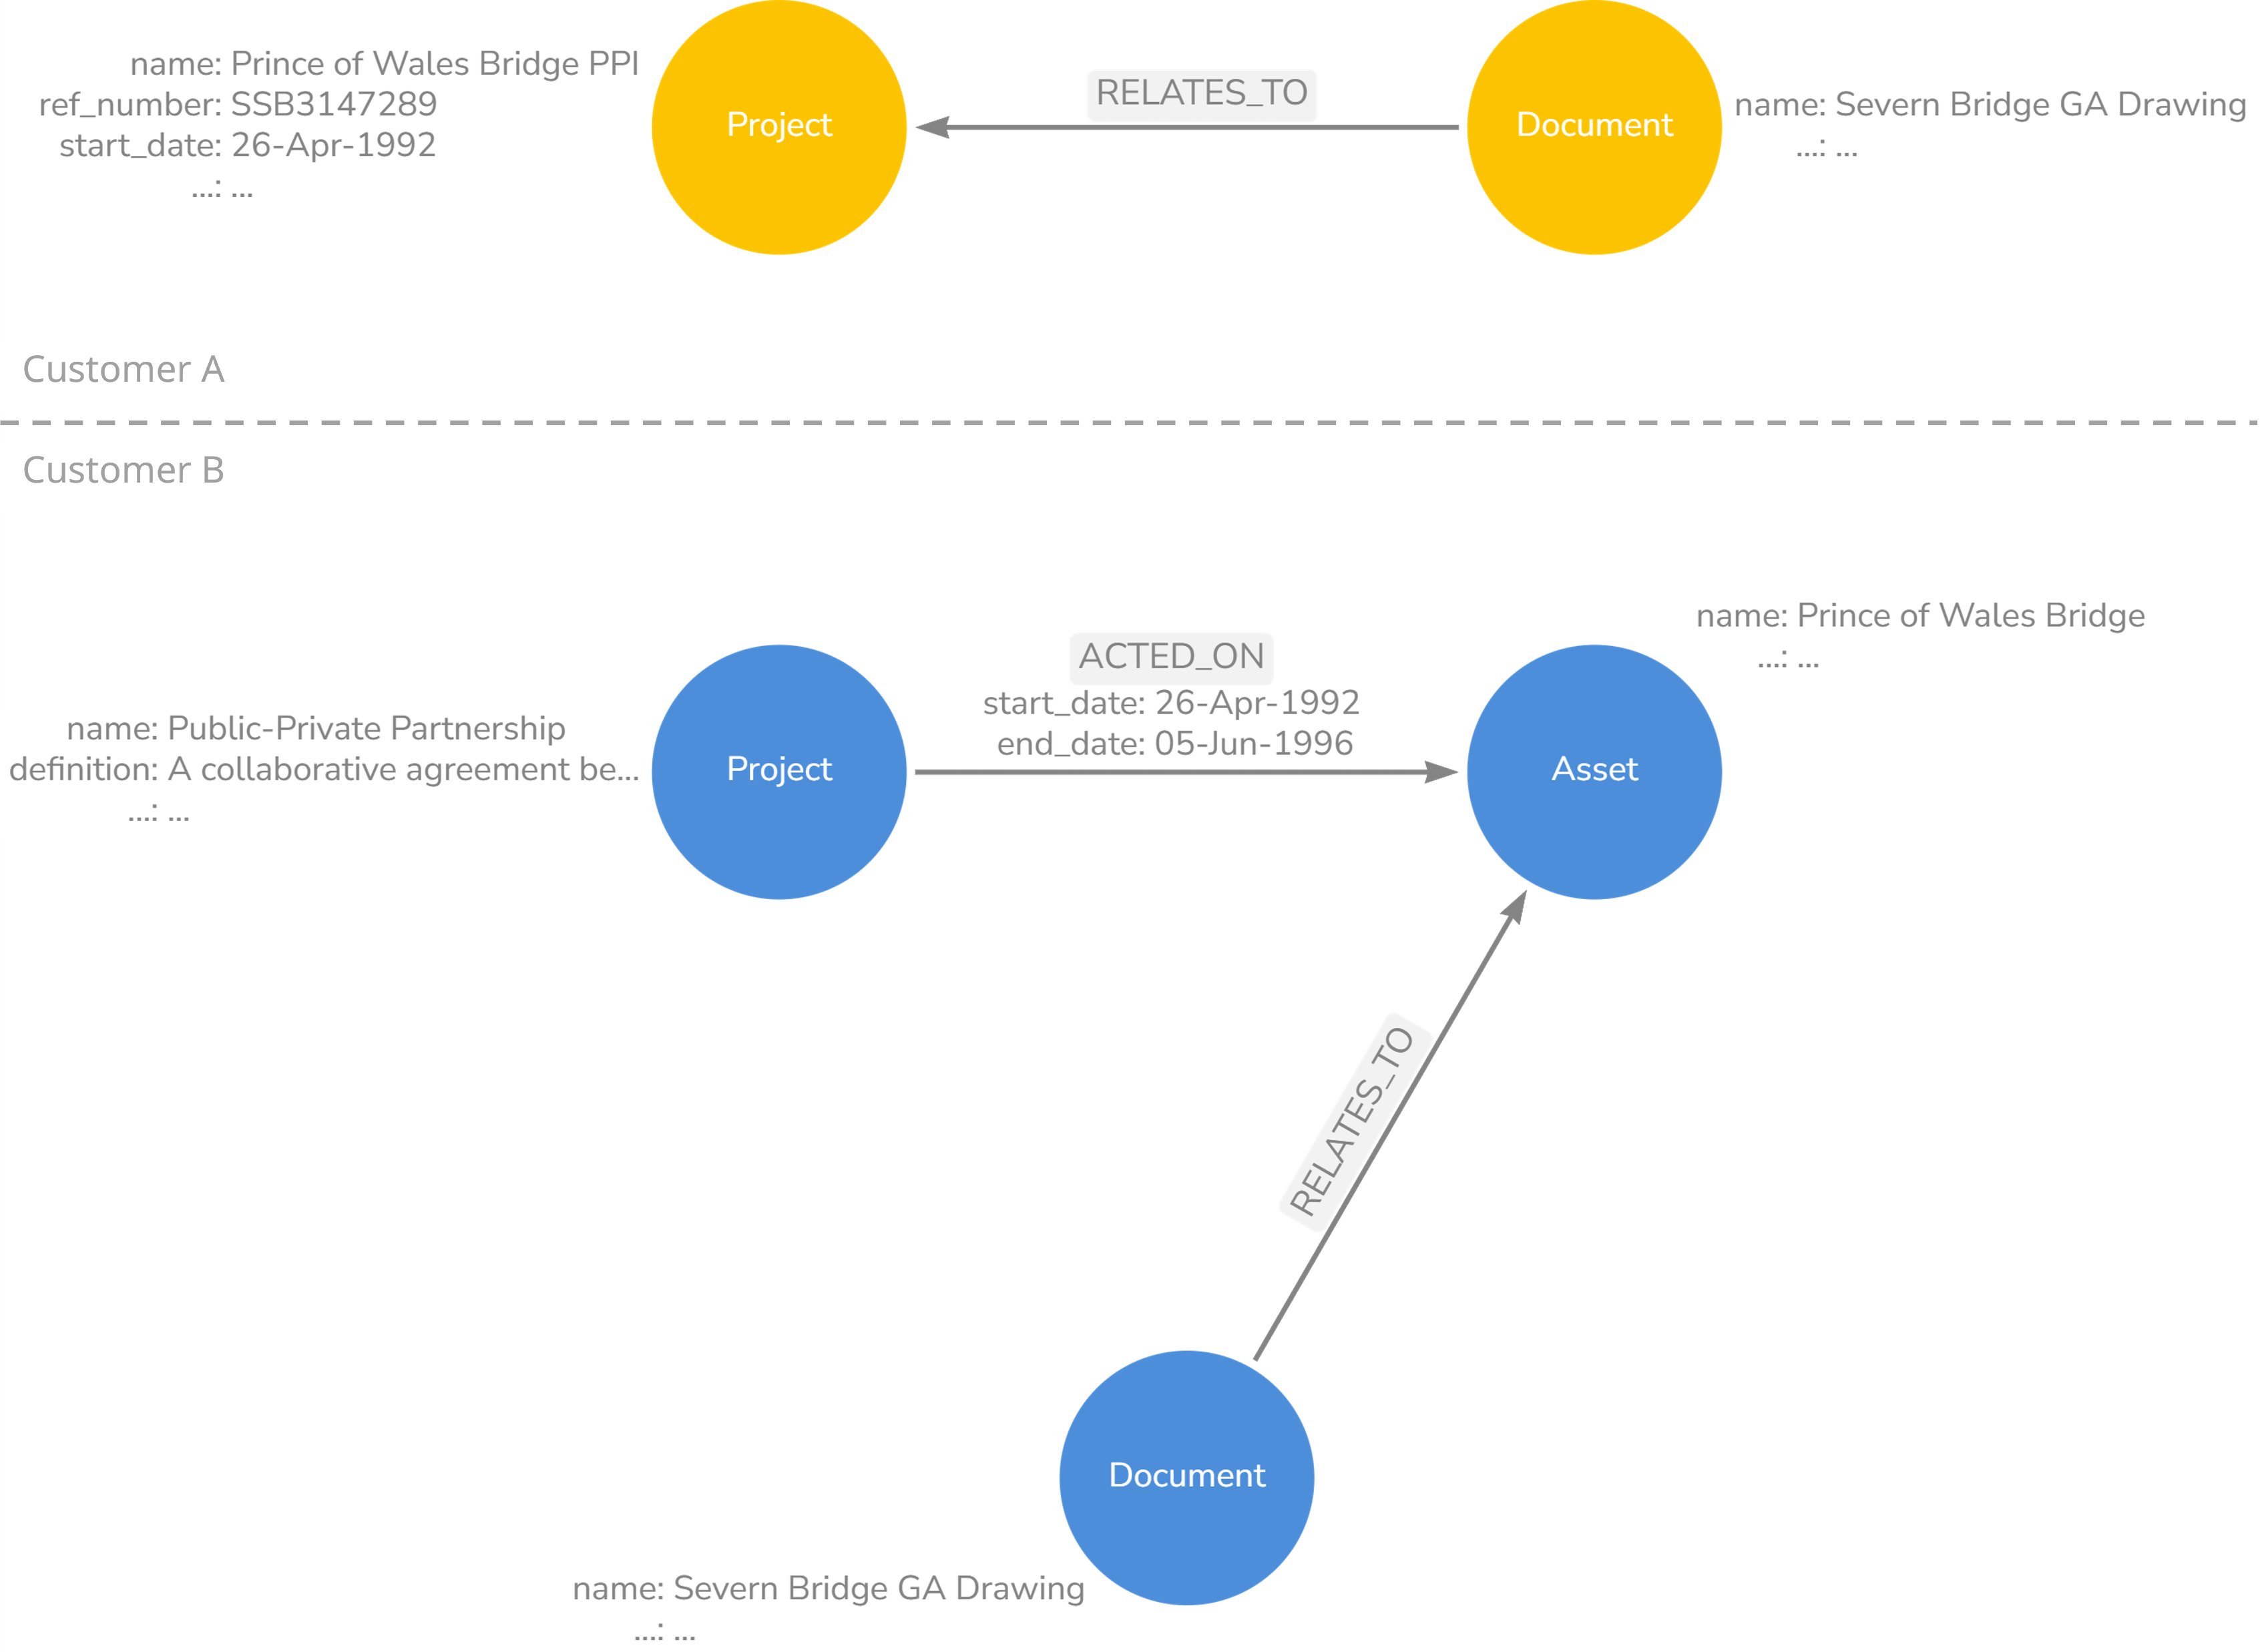 Figure 1: ‘Project’ graph nodes could be things (Customer A) or types of things (Customer B), with different mandatory properties in each scenario. Validation logic must apply at the sub-graph and not the database level
The third and final challenge centred around how to integrate our database with our frontend application and Hoppa Workbench analytics engine. Neo4J has a well-documented API that we could call from the Hoppa REST API, however our API would expect data to conform to a certain structure. We wanted the fast node-traversal benefits of a graph, but we couldn’t afford for our graph to stray too far from our own Hoppa business logic, as this could make parts of the graph un-interpretable to our API.
How we tackled these challenges
You’ve probably spotted by now that all three challenges are variations on a theme – how to balance between hard-coded business logic, customisability and extensibility.
Database schema controls
Starting from the final challenge, our first design choice was to master the graph data model and property constraints in our API. Our API is written in Python, so we used Pydantic for the class and property logic and developed a custom service for applying property constraints when deploying a new database.
The rule was that no new node or relationship types could be created unless it was through this service. This governance model gave us a point of fixity we would eventually use to build out the API logic for interacting with our database.
However, this design choice did place extra importance on thorough data modelling. We couldn’t simply migrate data across from our key-value store and generate entity types on the fly (as so many online GraphRAG tutorials do). Instead, we needed to be 100% sure that our data model could accommodate any potential customer use case. Developing a universal data model for storing multiple customer’s metadata models was admittedly a bit of a mind-bender, but we got there in the end.
Business logic abstraction and meta graphs
The logical data model we landed on was kept deliberately empty of customer business logic. For example, our data model defines entities for MetadataProperty and PropertyValue, but it doesn’t presume there’s also an entity for CertificateValidityPeriod or Project - the data model is effectively a blank slate.
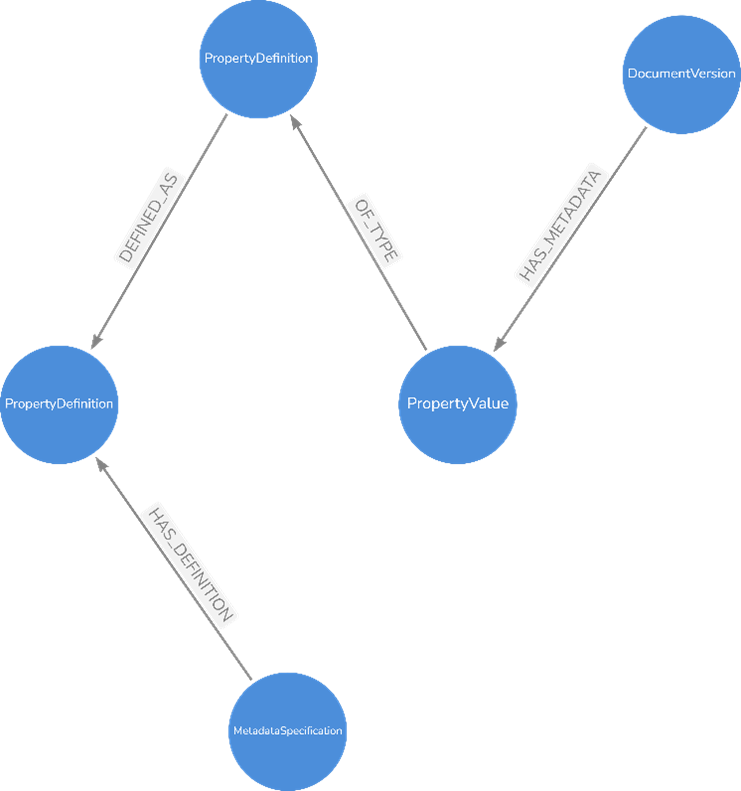 Figure 2: Snippet of the conceptual data model
The next design choice was how to selectively inject this business context back into the physical data model for use in the web application, AI agents or other actors. We adopted the concept of a ‘meta graph’ for this.
A meta graph is a virtual graph that represents the entity and relationship types in a graph. In concrete terms, if our logical data model defines the concept of a MetadataProperty as a thing or a list of things, then in our physical data model the meta graph builds on a MetadataProperty node to assert things like:
- The name of the MetadataProperty (e.g. Certificate Expiry Period or Project)
- The plain-language definition of the field
- Other related concepts, such as the type of documents that would be expected to possess the property
The meta-graph I’m referring to is different from the graph data model depicted in Figure 2. The latter is the conceptual blueprint for building a physical graph database, whereas the former defines business logic. In some of the sources I’ve read these concepts get conflated. The meta-graph is more like an ontology (or a fragment of one), but I’m not 100% comfortable with this term as it implies a level of detail / complexity that our meta-graph doesn’t seek to represent (yet).
The meta graph is semantically rich, which makes it perfect to pass to LLMs when performing classification, named entity recognition or summarisation tasks. Something we’re only beginning to explore is the mapping of concepts into upper ontologies, such as SUMO or IES4. Extending metadata property definitions in this way would form the basis for interoperability across systems and organisations.
Logic validation
Our meta graph / ontologies adhere to RDF (Resource Description Framework) syntax, which makes it possible to parse them programmatically. This is powerful when it comes to verifying the consistency of metadata in our physical graph, as we can use the meta graph to assert facts about our graph and test for their truthfulness. We do this by including SHACL (Shapes Constraint Language) shape definitions in our ontologies.
Returning to our Certificate Validity Period example, we can assert that the value must be a date range starting on or after 1st September 2025 and lasting no longer than 3 years. SHACL allows us to assure the outputs of any generative AI processing steps, and re-run or fail the process if the data is not in the shape we’d expect.
This level of governance is quite involved, but we believe necessary when dealing with metadata regarding safety-critical processes and built assets. It turns out LLMs are quite adept at generating SHACL when correctly prompted, helping us to manage the configuration burden.
We’re still learning about the best ways to approach shape constraint definition and validation, but see SHACL-based meta graphs as a pragmatic means of controlling business definitions within and isolating business definitions between customers.
What other challenges have surfaced?
We’re still learning about the new architecture, what it means for our product roadmap and how we serve customers.
Separating the Hoppa data model from both the physical data layer and customer business logic has given us a really tight level of control over what had the potential to be a messy, schema-less integration challenge.
The main trade-offs are on latency – we’ve inevitably introduced more steps in our read/write logic – and engineer onboarding – distributing logic across systems and languages will take new starters some time to develop an in-depth understanding. We believe we can manage both of these challenges through careful engineering and clear documentation.
What’s next?
We’re excited about the new service models this architecture unlocks. Previously, customers would typically use Hoppa (as the name implies) as a funnel, enriching data as it moved from one storage system to another at the project level. Now, we’re starting to build up an interconnected picture at the portfolio, organisational or JV / consortium level. This ‘golden thread’ of data flows is a valuable source of insight that our customers can use for operational efficiency and service transformation over the medium to long-term.
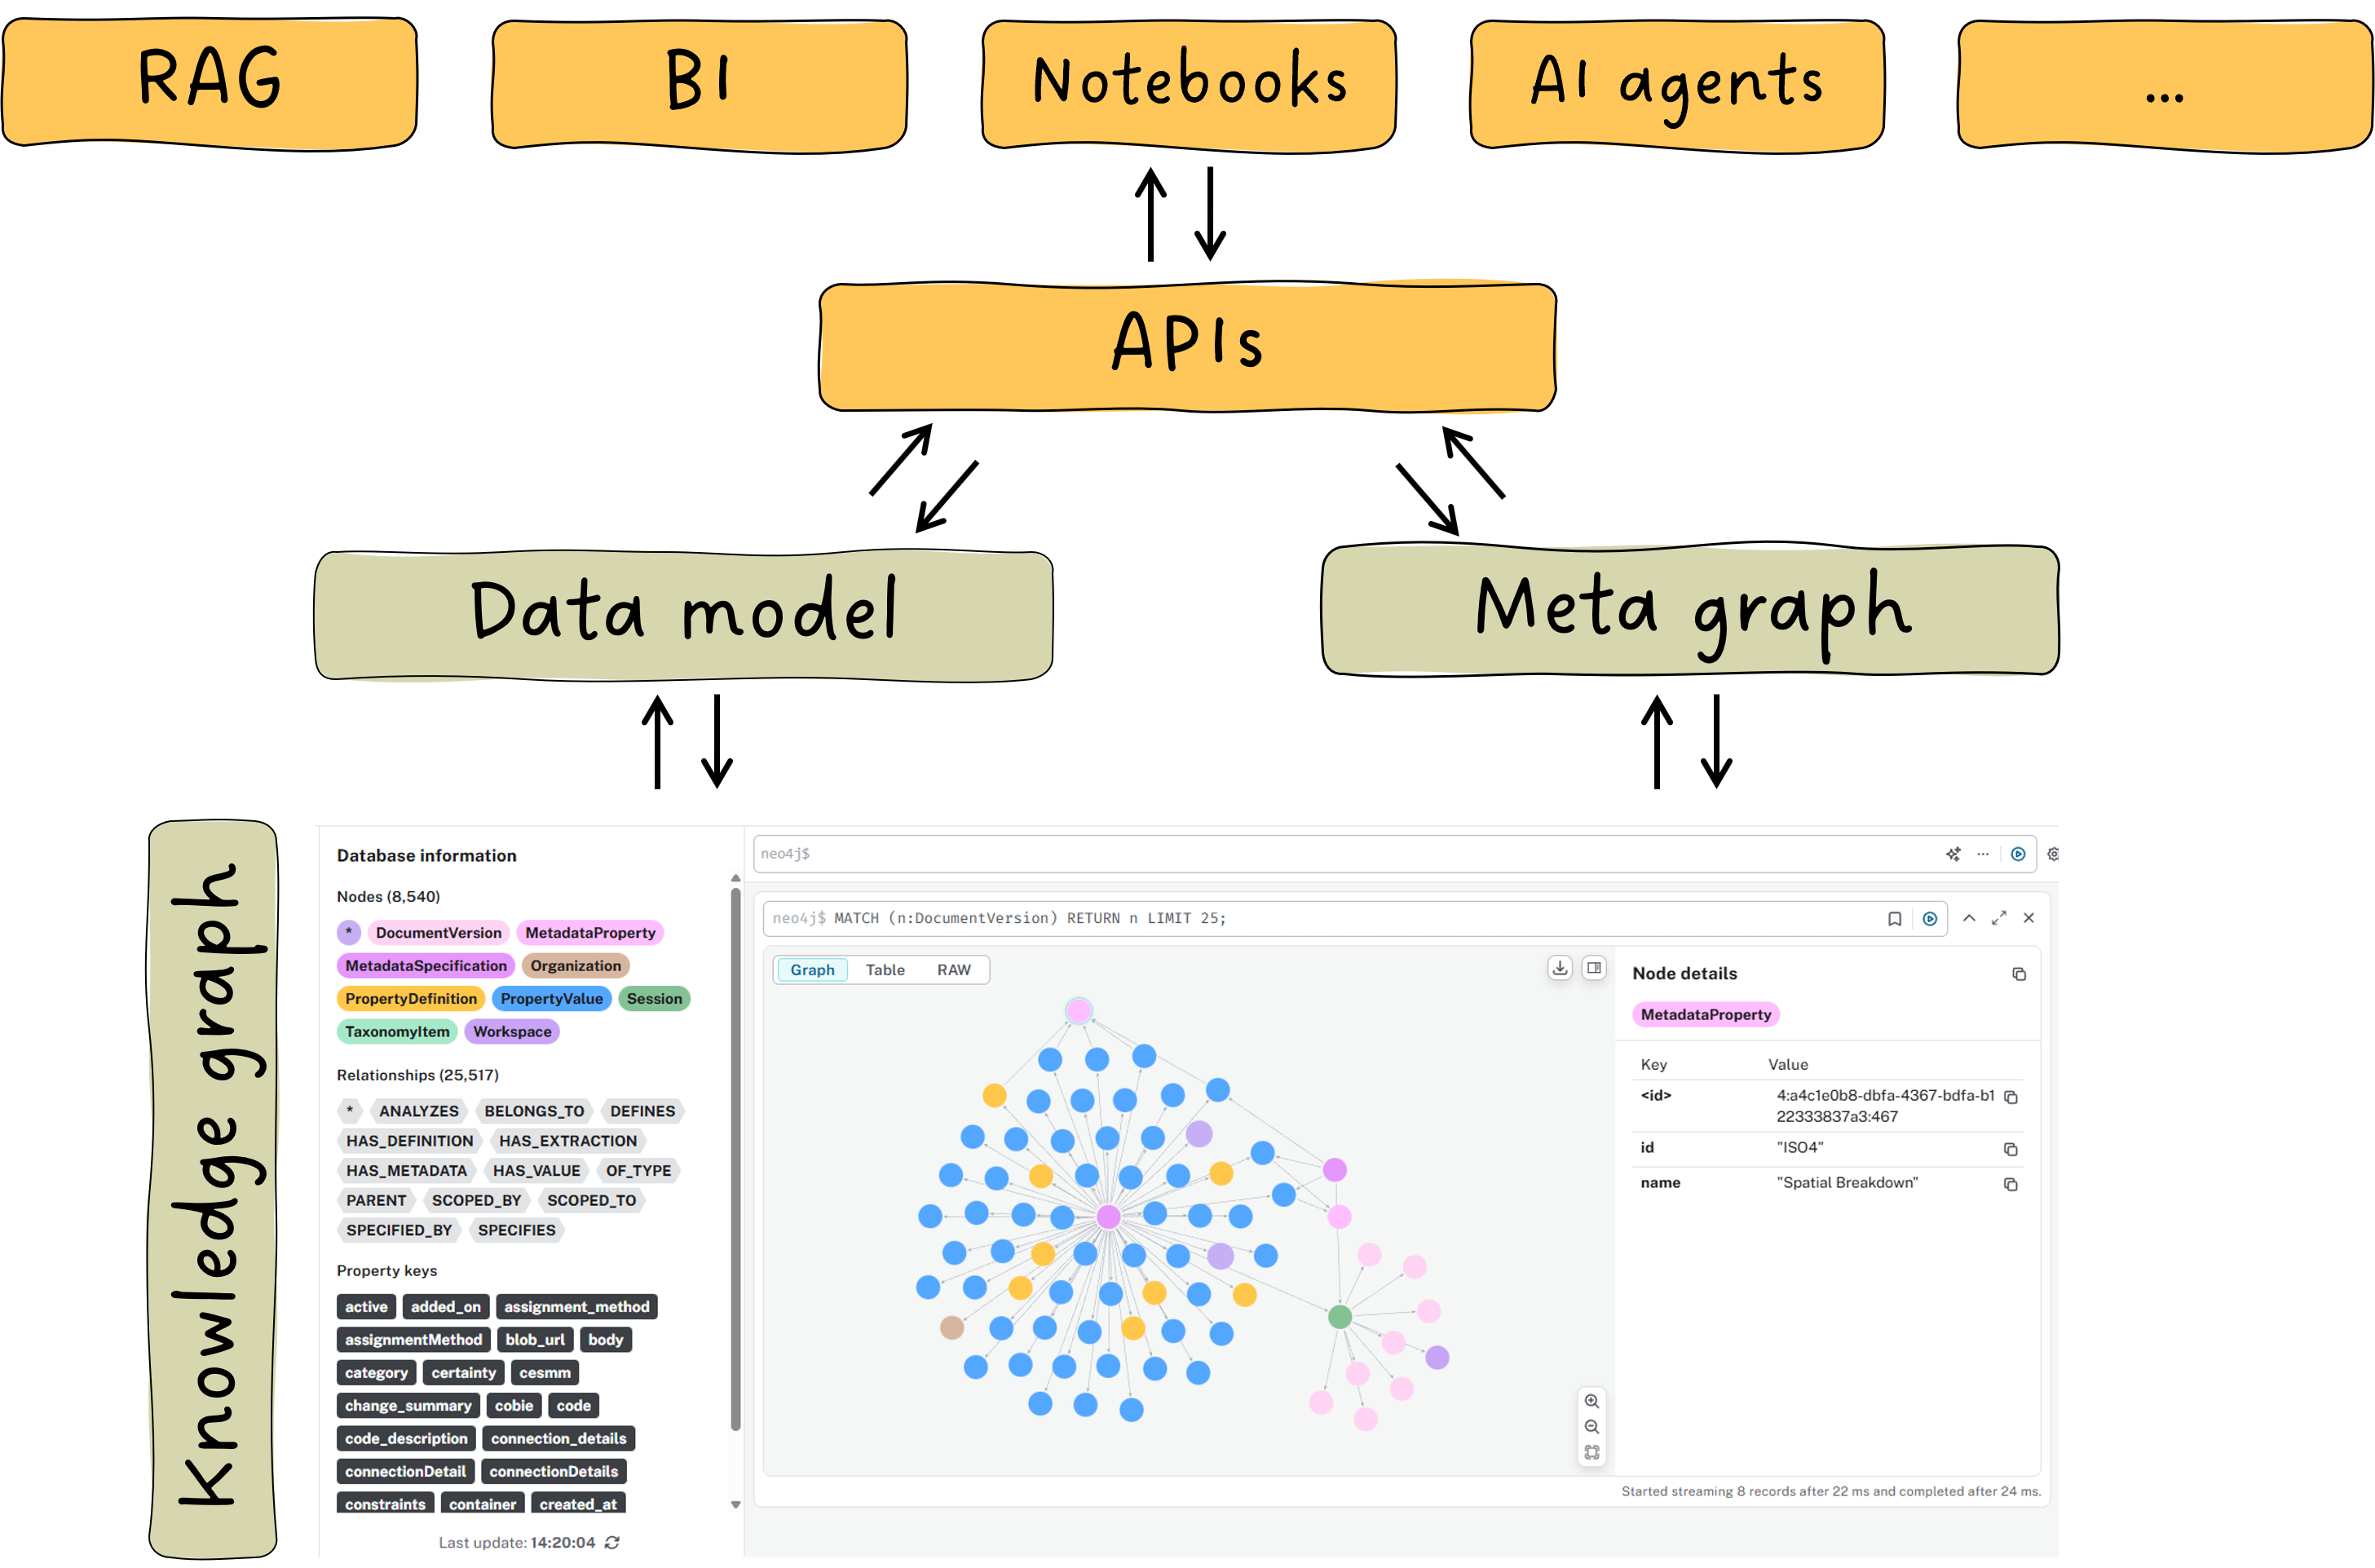 Figure 3: Meta graphs and graph data models unlock scaled integration of knowledge graphs with other systems
This is also opening up new ways to consume our data services. For example, by integrating Hoppa with chat copilots via our MCP server – currently in private beta – customer teams can use Hoppa as the semantic layer to search across multiple vendor platforms. Or, customers can use Hoppa to level up BI dashboards by integrating data held in unstructured formats (images, reports).
These are a couple of early ideas – our future direction will always be driven by customer needs – but what is clear is that the meta graph architecture extends our ability to take on complex customer challenges and stay adaptive in a changing business landscape.
Feeling inspired?
See Hoppa in action and learn how it can make the difference to your workflows.